I’ve been working on some notes for my students on Neural Networks. I am using Pandoc to write the text, and convert it back to LaTeX for PDF generation, and to HTML, for making the documents available online. In a future post I might talk about Pandoc, but for now, I want to share something I found on TeX Stack Exchange to plot functions. To make it clear how to use, I am presenting four simple examples: four common activation functions used in Neural Networks.
To start with, the well known sigmoid function: \[a = \frac{1}{1+e^{-z}}\]:
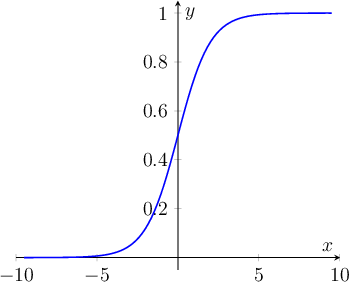
This can be achieved with the following tikzpicture environment:
\begin{tikzpicture}
\begin{axis}[
    axis lines=middle,
    xmax=10,
    xmin=-10,
    ymin=-0.05,
    ymax=1.05,
    xlabel={$x$},
    ylabel={$y$}
]
\addplot [domain=-9.5:9.5, samples=100,
          thick, blue] {1/(1+exp(-x)};
\end{axis}
\end{tikzpicture}
Now, for the tanh, defined as \[a=\frac{e^z – e^{-z}}{e^z + e^{-z}}\], you get:
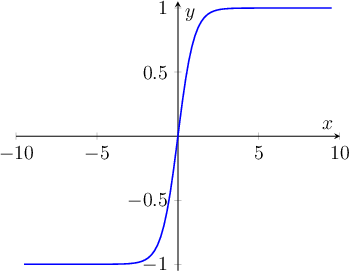
With the following code:
\begin{tikzpicture}
\begin{axis}[
    axis lines=middle,
    xmax=10,
    xmin=-10,
    ymin=-1.05,
    ymax=1.05,
    xlabel={$x$},
    ylabel={$y$}]
\addplot [domain=-9.5:9.5, samples=100,
     thick, blue] {(exp(x) - exp(-x))/(exp(x) + exp(-x))};
\end{axis}
\end{tikzpicture}
I was already loving it, but it was awesome when I tested the ReLU math, and it worked as expected: \[a=\max(0, z)\]
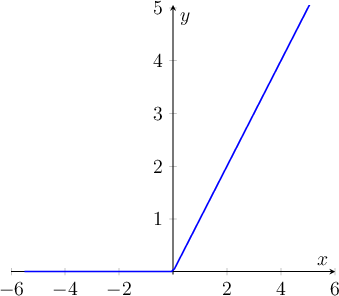
This one can be obtained using the simple…
\begin{tikzpicture}
\begin{axis}[
    axis lines=middle,
    xmax=6,
    xmin=-6,
    ymin=-0.05,
    ymax=5.05,
    xlabel={$x$},
    ylabel={$y$}]
\addplot [domain=-5.5:5.5, samples=100, thick, blue] {max(0, x)};
\end{axis}
\end{tikzpicture}
And now, although not being extremely interesting, the Leaky ReLU (well, not implemented exactly as the definition, just to get it a little more easy to read): \[a=max(0.001 \times z, z)\]
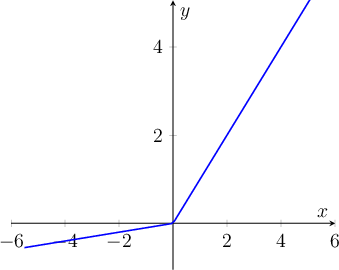
With the cheating…
\begin{tikzpicture}
\begin{axis}[
    axis lines=middle,
    xmax=6,
    xmin=-6,
    ymin=-1.05,
    ymax=5.05,
    xlabel={$x$},
    ylabel={$y$}]
\addplot [domain=-5.5:5.5, samples=100,
          thick, blue] {max(0.1 * x, x)};
\end{axis}
\end{tikzpicture}
And to conclude, and just for reference, do not forget to load the required packages:
\usepackage{tikz}
\usepackage{pgfplots}